Williamson County leads U.S. in job growth for fourth consecutive quarter
Williamson County leads U.S. in job growth at 6.7 percent
Source: Bureau of Labor Statistics
For release 10:00 a.m. (EST), Wednesday, December 7, 2016
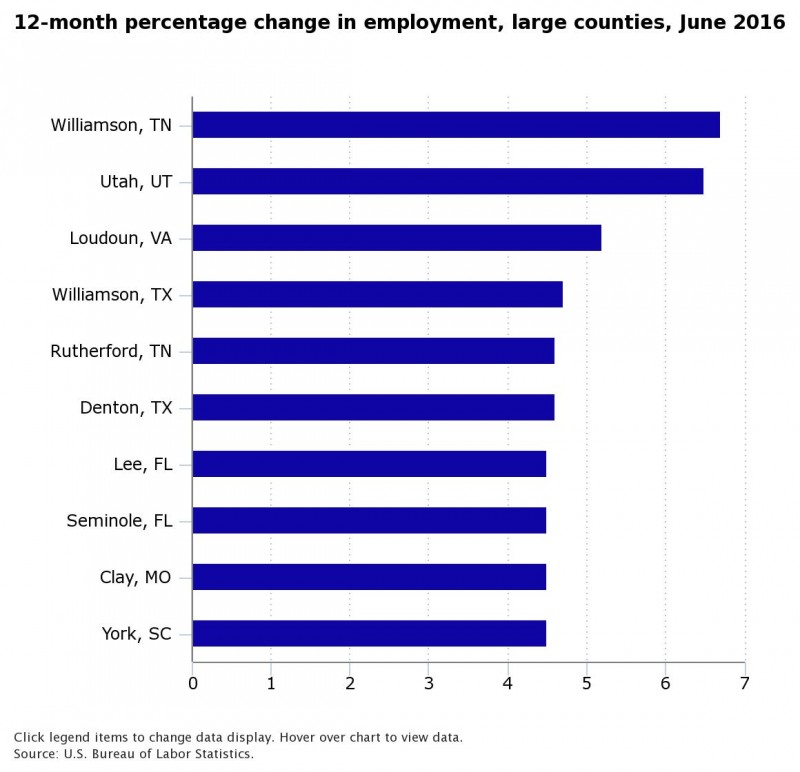
Chart: Brentwood Home Page
COUNTY EMPLOYMENT AND WAGES
Second Quarter 2016
From June 2015 to June 2016, employment increased in 291 of the 344 largest U.S. counties, the U.S. Bureau of Labor Statistics reported today. Williamson, Tenn., had the largest percentage increase with a gain of 6.7 percent over the year, above the national job growth rate of 1.5 percent. Within Williamson, the largest employment increase occurred in professional and business services, which gained 3,033 jobs over the year (9.6 percent). Midland, Texas, had the largest over-the-year percentage decrease in employment among the largest counties in the U.S., with a loss of 8.3 percent. Within Midland, natural resources and mining had the largest decrease in employment, with a loss of 2,767 jobs (-13.1 percent). County employment and wage data are from the Quarterly Census of Employment and Wages (QCEW) program, which provides the only detailed quarterly and annual universe count of establishments, employment, and wages at the county, MSA, state, and national levels by detailed industry. These data are published within 6 months following the end of each quarter.
The U.S. average weekly wage increased 2.2 percent over the year, growing to $989 in the second quarter of 2016. McLean, Ill., had the largest over-the-year percentage increase in average weekly wages with a gain of 21.0 percent. Within McLean, an average weekly wage gain of $739 (42.2 percent) in financial activities made the largest contribution to the county’s increase in average weekly wages. Ventura, Calif., experienced the largest percentage decrease in average weekly wages with a loss of 8.4 percent over the year. Within Ventura, manufacturing had the largest impact on the county’s average weekly wage decline with a decrease of $912 (-34.4 percent) over the year.
Large County Employment
In June 2016, national employment was 142.7 million (as measured by the QCEW program). Over the year, employment increased 1.5 percent, or 2.1 million. In June 2016, the 344 U.S. counties with 75,000 or more jobs accounted for 72.5 percent of total U.S. employment and 77.6 percent of total wages. These 344 counties had a net job growth of 1.7 million over the year, accounting for 82.0 percent of the overall U.S. employment increase. The five counties with the largest increases in employment levels had a combined over-the-year employment gain of 254,900 jobs, which was 12.1 percent of the overall job increase for the U.S. (See table A.)
Employment declined in 46 of the largest counties from June 2015 to June 2016. Midland, Texas, had the largest over-the-year percentage decrease in employment (-8.3 percent), followed by Lafayette, La.; Gregg, Texas; Peoria, Ill.; McLean, Ill.; and Washington, Pa. (See table 1.)
Read the full report here.